Price and Value
Value investing rests on the gap between what a business is worth and what it costs, yet almost no one asks how long that gap takes to close. Rolling-period data on the S&P 500, Berkshire, and Coca-Cola gives an uncomfortable answer: true convergence of price and value can take twenty-five years or more, though buying cheaply, sticking to quality, and holding a portfolio can meaningfully shorten the wait.
PDF Read the original — 9 figures, fully formatted ↗Perhaps the fundamental tenet of value investing is that price and value are different—that the value for anything can be more or less than the price you pay for it. Jeff and I got our investing religion from Buffett, so we often return to the source: in the 1987 Berkshire Hathaway Letter to Shareholders, he explains this concept beautifully (emphasis added):
Whenever Charlie and I buy common stocks for Berkshire’s insurance companies, we approach the transaction as if we were buying into a private business. We look at the economic prospects of the business, the people in charge of running it, and the price we must pay. We do not have in mind any time or price for sale. Indeed, we are willing to hold a stock indefinitely so long as we expect the business to increase in intrinsic value at a satisfactory rate. When investing, we view ourselves as business analysts - not as market analysts, not as macroeconomic analysts, and not even as security analysts.
Our approach makes an active trading market useful, since it periodically presents us with mouth-watering opportunities. But by no means is it essential: a prolonged suspension of trading in the securities we hold would not bother us any more than does the lack of daily quotations on World Book or Fechheimer. Eventually, our economic fate will be determined by the economic fate of the business we own, whether our ownership is partial or total.
Ben Graham, my friend and teacher, long ago described the mental attitude toward market fluctuations that I believe to be most conducive to investment success. He said that you should imagine market quotations as coming from a remarkably accommodating fellow named Mr. Market who is your partner in a private business. Without fail, Mr. Market appears daily and names a price at which he will either buy your interest or sell you his.
Even though the business that the two of you own may have economic characteristics that are stable, Mr. Market’s quotations will be anything but. For, sad to say, the poor fellow has incurable emotional problems. At times he feels euphoric and can see only the favorable factors affecting the business. When in that mood, he names a very high buy- sell price because he fears that you will snap up his interest and rob him of imminent gains. At other times he is depressed and can see nothing but trouble ahead for both the business and the world. On these occasions he will name a very low price, since he is terrified that you will unload your interest on him.
Mr. Market has another endearing characteristic: He doesn’t mind being ignored. If his quotation is uninteresting to you today, he will be back with a new one tomorrow. Transactions are strictly at your option. Under these conditions, the more manic- depressive his behavior, the better for you.
But, like Cinderella at the ball, you must heed one warning or everything will turn into pumpkins and mice: Mr. Market is there to serve you, not to guide you. It is his pocketbook, not his wisdom, that you will find useful. If he shows up some day in a particularly foolish mood, you are free to either ignore him or to take advantage of him, but it will be disastrous if you fall under his influence. Indeed, if you aren’t certain that you understand and can value your business far better than Mr. Market, you don’t belong in the game. As they say in poker, “If you’ve been in the game 30 minutes and you don’t know who the patsy is, you’re the patsy.”
Ben’s Mr. Market allegory may seem out-of-date in today’s investment world, in which most professionals and academicians talk of efficient markets, dynamic hedging and betas. Their interest in such matters is understandable, since techniques shrouded in mystery clearly have value to the purveyor of investment advice. After all, what witch doctor has ever achieved fame and fortune by simply advising “Take two aspirins”?
The value of market esoterica to the consumer of investment advice is a different story. In my opinion, investment success will not be produced by arcane formulae, computer programs or signals flashed by the price behavior of stocks and markets. Rather an investor will succeed by coupling good business judgment with an ability to insulate his thoughts and behavior from the super-contagious emotions that swirl about the marketplace. In my own efforts to stay insulated, I have found it highly useful to keep Ben’s Mr. Market concept firmly in mind.
Following Ben’s teachings, Charlie and I let our marketable equities tell us by their operating results - not by their daily, or even yearly, price quotations - whether our investments are successful . The market may ignore business success for a while, but eventually will confirm it. As Ben said: ” In the short run, the market is a voting machine but in the long run it is a weighing machine .” The speed at which a business’s success is recognized, furthermore, is not that important as long as the company’s intrinsic value is increasing at a satisfactory rate. In fact, delayed recognition can be an advantage: It may give us the chance to buy more of a good thing at a bargain price.
We follow Buffett’s example and evaluate our companies based on their fundamentals, not the market’s short-term reactions (i.e., reflected in price fluctuations). However, value and price can deviate from each other for years at a time, and, much like other value investors, we have experienced a wide disparity between these two in recent years. So, inspired by François Rochon (a great Canadian value investor), we have begun reporting both price changes as well as our estimations in the changes in the value of our portfolio. After getting several questions from investors, we thought it made sense to delve into this in more detail.
Reported Metrics
Our recent reporting approach compares two metrics, the total returns and the total value creation over a given time period. Total return is simply the actual return an investor would get by buying and selling a security: the total price appreciation over the holding period plus any return of capital that occurred during the holding period, usually in the form of dividends. For example, if an investor bought a security for $10 at the beginning of a year, received $1 in dividends throughout the year, and sold the stock at the end of the year for $11, he has received $12 ($1 of price appreciation and $1 of dividends) on a $10 investment, which is a total return of 20%. If, instead of selling, he held the stock for another year, receiving another $1 in dividends and having an ending price of $12, his second year total return would
be approximately 18% ($13 of final capital / $11 of initial capital). The total return over the two years would be approximately 42% or, expressed in an annualized form, approximately 19%.
Total value creation, in contrast, is the combination of change in intrinsic value and any return of capital over the holding period. Of course, while measuring the change in price is extraordinarily easy, measuring changes in intrinsic value is quite another matter. Buffett also talks about this on page 4 of the Berkshire Hathaway Owner’s Manual:
Intrinsic value is an all-important concept that offers the only logical approach to evaluating the relative attractiveness of investments and businesses. Intrinsic value can be defined simply: It is the discounted value of the cash that can be taken out of a business during its remaining life.
The calculation of intrinsic value, though, is not so simple. As our definition suggests, intrinsic value is an estimate rather than a precise figure, and it is additionally an estimate that must be changed if interest rates move or forecasts of future cash flows are revised. Two people looking at the same set of facts, moreover – and this would apply even to Charlie and me – will almost inevitably come up with at least slightly different intrinsic value figures.
Because we cannot know the future cash flows of a company with precision, we are left with imperfect proxies for changes in intrinsic value and ones that may vary depending on the company in question. For example, for most of Berkshire Hathaway’s history, Buffett advocated using changes in book value as a rough proxy for changes in intrinsic value. On the other hand, since intrinsic value is calculated from the amount of cash that can be taken out of a business over its life, perhaps the simplest proxy for changes in intrinsic value is the growth in owner earnings, which is the portion of earnings that could be distributed to owners each year. Earnings growth itself may also be effective, as the growth in earnings over extended periods generally approximates the growth in owner earnings.
The total value creation then, is the combination of this change in intrinsic value (approximated by whichever proxy is used) plus any return of capital, calculated similarly to total return above, except replacing price changes with intrinsic value changes. Moreover, this total value creation does not have anything to do with the gap between price and value (if it exists), nor does the comparison of value creation and total return relate to a closing of such a gap.
When Does Weight Matter?
If, as Graham posits, over the long term the stock market is a weighing machine, then the total return and the total value creation should be roughly equal to each other when measured over a sufficiently long period. The immediate and obvious question (and indeed, the most common question we received) is just how long ‘the long term’ really is. To answer this question, we compared total returns and total value creation for the S&P 500, Berkshire Hathaway, and The Coca Cola Company. Inherent to this comparison is the assumption that while any particular year’s reported results (e.g., earnings or book value) might be distorted by one-time events, temporary market conditions, or accounting issues, they mostly even out over the long term. Additionally, the results of the comparison presented below does not adjust for interest rate changes. While we did separately perform the comparison with such an adjustment, we found that although the data was different in some respects, the conclusions were largely the same. Accordingly, we opted to show the results for the unadjusted analysis to keep things simple.
Testing Using S&P 500
For the S&P 500, we used Robert Shiller’s data from 1871-2019 to compare total returns and total value creation. Over the entire period, the total return compounded at an annual growth rate of 8.9% and total value creation (as approximated by earnings growth, including dividends) compounded at 8.7%, a difference of only 0.2% a year. Thus, over an extremely long period, it holds true that price and value are approximately equal. However, this does not tell us how long a discrepancy between the two can last, or how big that discrepancy might be. To answer that question, we measured rolling annualized differences over periods from 1 year to 40 years, which are summarized below.
For each rolling period, we calculated the difference between total return and total value creation. Thus, a positive difference means that price growth outpaced value creation, and a negative difference means that value creation outpaced price growth. For various rolling periods, these differences are then shown in a histogram. We also show statistics for each data set, including the percent of the time the difference was positive (and hence price change was greater than value change), the percent of the time that the difference was less than 1%, 2%, and 3%, the mean difference, the minimum difference, the maximum difference, and the standard deviation.
S&P 500: 1 Year Difference
The following provides the histogram and statistics for every one year difference between total return and total value creation.
1 Year Difference Histogram
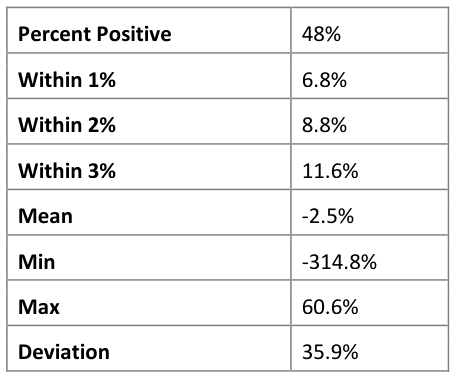
Deviation 35.9%
As expected, within 1 year, the two deviate wildly from one another, and seem to have very low correlation.
S&P 500: 5 Year Difference
The following provides the histogram and statistics for rolling, annual five year differences between total return and total value creation.
5 Year Difference Histogram
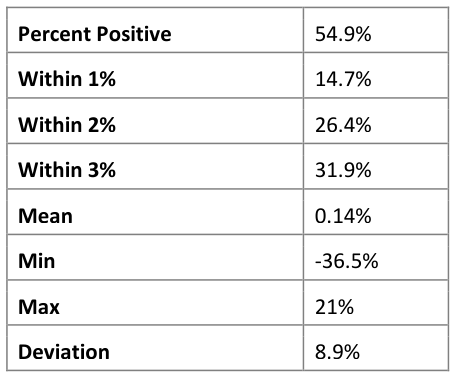
Deviation 8.9%
At five years, there is more tightening, but still significant variance between price and value.
S&P 500: 10 Year Difference
The following provides the histogram and statistics for rolling, annual ten year differences between total return and total value creation.
10 Year Difference Histogram
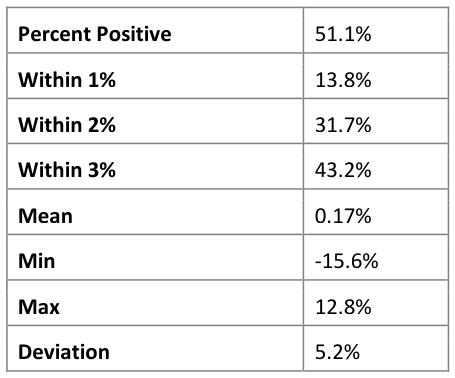
Deviation 5.2%
At 10 years, variance has decreased significantly, and growth and value are within 3% almost half of the time.
S&P 500: 25 Year Difference
The following provides the histogram and statistics for rolling, annual twenty-five year differences between total return and total value creation.
25 Year Difference Histogram
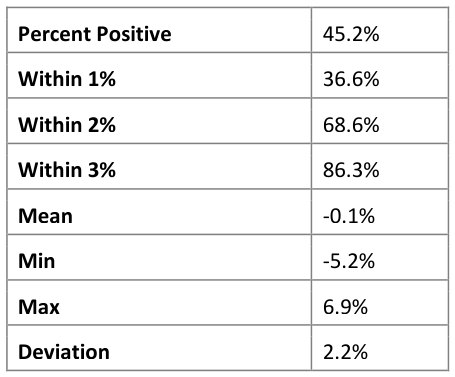
Deviation 2.2%
At 25 years, even more tightening occurs, and price and value are within 3% almost all of the time, and within 2% most of the time.
S&P 500: Summary
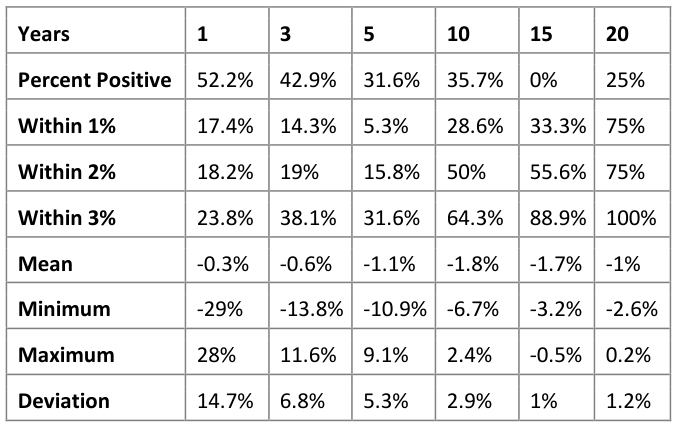
Rather than continue to show histograms for longer periods, which are increasingly uninteresting, the following table summarizes the results for all measured rolling periods up to 40 years.
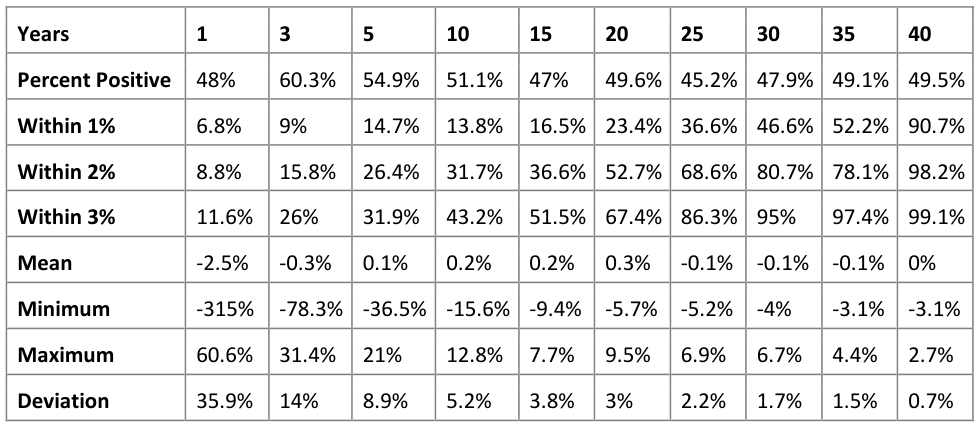
As shown, at 1 year, there is almost no correlation between the growth of price and the growth of value. While there is tightening as the length increases, it really isn’t until 10-20 years that the two metrics start to converge. At 25 years or more, there is fairly strong convergence that increases with increasing length. For example, at 40 years, virtually all rolling periods fall within 1%.
Berkshire Hathaway: Summary
For Berkshire Hathaway, we used the reported values from the 2018 Annual Report, which compares changes in book value per share with changes in market value per share, over the period from 1964-2018. Over the entire period, the total return compounded at an annual growth rate of 20.5% and value creation (as approximated by book value growth) compounded at 18.7%, a difference of 1.7% a year. As Buffett has noted in the past, book value growth underestimates intrinsic value growth. However, this underestimation can be adjusted for relatively easily by adding a growth rate for the additional IV growth over time. For example, assuming that the original book value approximated intrinsic value, but that a multiple of 1.75 of book is more appropriate at year end 2018 (based on Buffett’s buyback comments in the 2019 Annual Meeting), approximately 1% a year could be added, reducing the overall difference to 0.7% a year. Thus, over the entire period, price and value have been close to each other. Rather than show histograms and statistics for each rolling period, the following shows the statistics similar to the S&P summary above, including the 1% a year addition to book value growth.
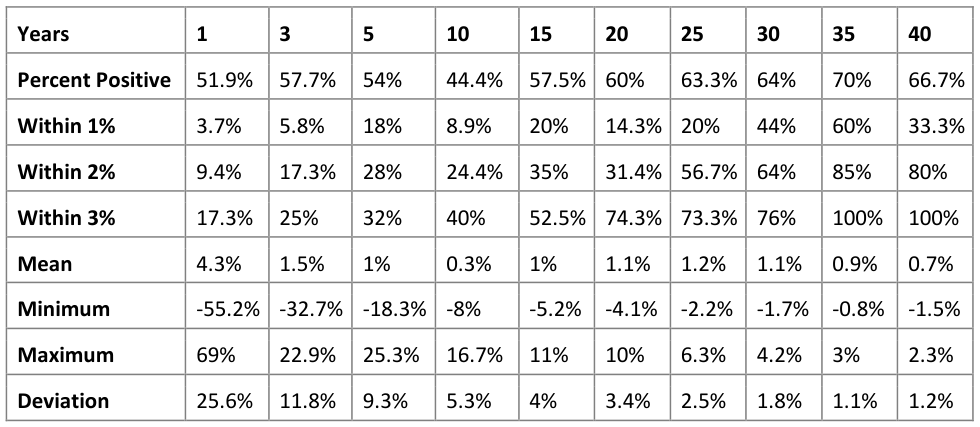
It is worth noting that the data at 30, 35, and 40 years becomes somewhat sparse, at least compared to the S&P 500, due to the shorter overall period under analysis. For Berkshire, a similar trend as the S&P 500 does seem to appear: little or no correlation over 1, 3, and 5 year periods; higher correlation for 10, 15, and 20 year periods; and much stronger correlation at 25 years or more.
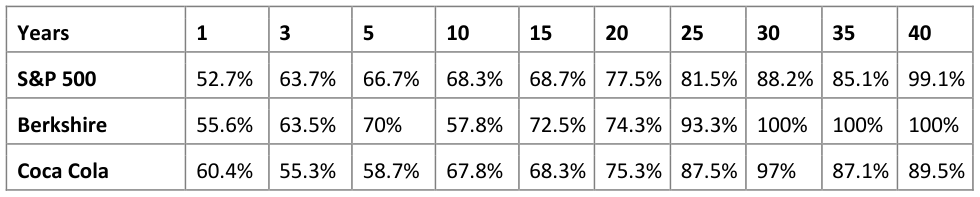
The Coca Cola Company: Summary
For The Coca Cola Company, we used data starting from 1920 to compare total returns and total value creation. Over the entire period, the total return compounded at an annual growth rate of 14.6% and total value creation (as approximated by earnings growth, including dividends) compounded at 13.1%, a difference of 1.5% a year. Thus, over an extremely long period, there is a strong relationship between the two, though not as strong as has been the case for the S&P 500. The table below shows the results for up to rolling 40 year periods, similar to the summaries of the S&P 500 and Berkshire Hathaway.
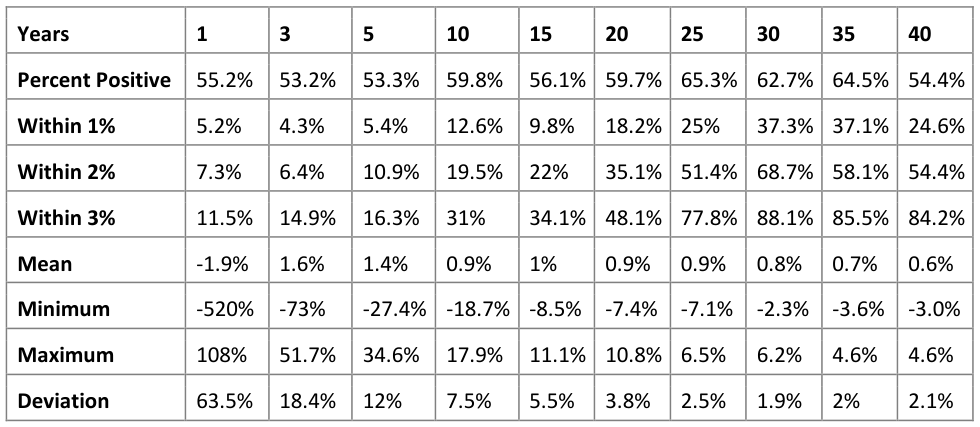
Results for Coca Cola effectively stabilized around the 25-30 year periods (as evidenced by the standard deviation) and did not tighten further with longer rolling periods.
Mitigating Time Length
While value investors continuously talk about investing for the “long term”, it is likely the case that relatively few of them are talking about holding periods of 20 years or more. Nonetheless, it appears that this type of time horizon may be required in order to expect true convergence between value and price. While this length may seem excessive at first blush, it can make sense by considering a few common scenarios: distortions in reported values at or around panics or crises (e.g., the Great Depression, stagflation in the 70s, the Internet Bubble, the Financial Crisis, etc.), multi-decade changes in interest rates (e.g., 1970s-2000s), and changes in the multiples paid for individual companies or the overall stock market, among others.
That being said, most investors don’t actually care if the total returns match the total value created, they only care if it is reasonably close or better . If, instead of asking if the difference was within 2%, we asked if it was better than -2% (thereby including any results where price outpaced value, including over 2%), the results are significantly different, and the required holding period is generally much shorter.
Additionally, it is possible that the time period could be further mitigated by a few strategies. First, an active buyer has control over the initial price paid. For example, an investor that does not overpay for companies can likely skew the results towards outcomes where price growth matches or exceeds value growth within a shorter time period (e.g., 5-10 years). A corollary is that avoiding overpaying improves the likelihood of total returns matching or exceeding value creation. For example, by avoiding purchasing Coca Cola in 1998, when it traded at a very high historical multiple of earnings, an investor could escape a 15+ year period where value significantly outpaced price. Thus, by intelligently buying at more conservative prices, investors may be able to skew their results such that total returns are more likely to either match or exceed value creation, allowing for shorter time periods.
Second, it appears that there may be a positive skew for higher quality companies. For example, both Berkshire Hathaway and The Coca Cola Company are high quality companies, and, as shown by their mean values, minimum values, and maximum values, price tends to outpace value over time. For example, at the 15 year mark, the S&P 500 has a mean of 0.2%, a minimum of -9.4%, and a maximum of 7.7%. In comparison, at the same time length, both Berkshire and Coca Cola have higher averages, minimums, and maximums than the S&P 500.
Third, holding a portfolio of companies appears to have some advantages. For example, in this limited comparison, the data for the S&P 500 seems to converge more quickly and to a tighter level than the individual companies. Moreover, an active investor has the ability to realize gains from those companies that have matched or exceeded value over a shorter time period and potentially replace them with other investments, which can lead to a shorter average time to convergence for the overall portfolio.
As a case in point, consider Giverny Capital’s track record (managed by François Rochon), which has tracked its companies’ value creation (as measured in changes in owner earnings, plus dividends) as compared to total return since 1996. Over the entire period, the annualized change in value has been 13.5% versus an annualized total return of 12.6%, a difference of 0.9% a year. We believe Giverny has utilized the three strategies above, and, as a result, the convergence between price and value seems to be faster than the S&P 500, Berkshire Hathaway, and the Coca Cola Company.