Evaluating Performance
Trailing one-, three-, five-, and ten-year returns hang on two arbitrary dates and can flatter or condemn a manager on the strength of a single lucky stretch. Rolling-period statistics fix this by asking how often a manager beat the benchmark across every possible holding window, and running the numbers on Buffett, Schloss, Munger and a dozen other value greats reveals who was genuinely consistent.
PDF Read the original — 41 figures, fully formatted ↗Evaluating a manager’s performance is not as easy as it seems. First, as discussed in the prior essay “Know Your Graph”, reported investment returns only represent one particular outcome and do not necessarily indicate investing ability. For example, tremendous returns may be achieved by taking on excessive risk, coupled with luck that the risk did not materialize into investment losses. Alternatively, a manager may have a great deal of skill but may encounter a series of unlucky outcomes. However, even ignoring this issue, the manner in which returns are typically reported does not even represent the actual investment outcomes that well!
The Endpoint Problem
The most common method of reporting returns is to list the trailing returns for each of various periods, usually 1, 3, 5, and 10 years. These trailing returns indicate the gains an investor would have obtained if he had invested with the manager 1, 3, 5, or 10 years ago. This method is used by Morningstar and brokerages as well as in regulatory filings for mutual funds.
While this trailing return method of reporting does give some idea of how returns have developed over time, it suffers from the fact that the trailing returns only represent the returns for a particular set of arbitrary dates—starting the day from 1, 3, 5, and 10 years ago and ending today (or some other final date). As a result, these trailing returns can only represent the manager’s performance assuming that those arbitrary periods are actually representative of the manager’s skill. Said another way, each value only represents the outcome of an investor who happened to buy exactly 1, 3, 4, or 10 years ago and sell on this particular day. Not surprisingly, this is unlikely to be representative of a manager’s overall performance. For example, consider the case where the manager has fairly consistent returns for 10 years at 10% a year, but the investment portfolio either suddenly increases or decreases by 25% over some short period of time leading up to the end of the measurement period. In either case, all of the values (1, 3, 5, and 10 year trailing returns) will be skewed up or down far away from the 10% average. Accordingly, the reported values do not represent anything other than investors’ returns whose holding periods exactly matched the periods in question—all other investor outcomes (e.g., selling at any time prior to that date) are unrepresented.
This endpoint problem may be particularly prominent for value investors, who generally attempt to invest countercyclically. For example, as an individual stock or the overall market becomes more expensive relative to underlying value, value investors will generally buy less of it, missing out on any upward momentum, which is difficult to predict. Additionally, this upward momentum typically occurs at the final stage of bull markets, which is often driven by multiple expansion rather than underlying growth. As a result, value investors are more likely to underperform the market as the bull market ages, and, depending on the length of the bull market, this underperformance may last for years. Thus, with this expected behavior, the trailing 1, 3, 5, and 10 year numbers may worsen over time, even if it allows the value investors to perform better later when the bull market finally ends (e.g., by having cash available to invest after the subsequent crash). To be clear, this endpoint problem does not excuse through-the-cycle underperformance for a manager, but it does mean that the current reporting method is simply not representative of returns over different periods of the investment cycle .
Statistical Reporting
Rather than reporting single period trailing returns, rolling period return statistics may better represent a manager’s performance. A rolling period is one where a fixed time length is used (e.g., 3 years) and a number of different periods are created by shifting the beginning and ending dates. For example, if a manager has seven years of returns from 2010 through 2016, then five different instances of 3 year returns can be generated, i.e., the 3 year returns from: 2010-2012, 2011-2013, 2012-2014, 2013-2015, and 2014-2016. Thus, instead of only reporting the current 3 year return from 2014-2016, returns for five different 3 year periods can be analyzed.
In order to generate and report rolling period statistics, these sets of rolling returns can be analyzed relative to a benchmark. For example, the analysis may simply involve the percentage of rolling periods where the manager outperformed an appropriate index. Thus, instead of reporting the typical single period trailing returns discussed above, the manager may report the percentage of rolling periods where the investor has beat the index. Generally, a great investor might beat the benchmark for 50% of all 1 year periods, 65% of all 3 year periods, 75% of all 5 year periods, 95% of all 10 year periods, and 100% of all longer periods. These statistics, given a large enough sample set, allow a potential investor to gain a probabilistic understanding of what future returns will look like for a given investment period with the manager. For example, if the manager outperforms the benchmark in 95% of all 10 year periods, then it seems likely that an investor will do well if he invested with the manager over the next 10 years. Further, if the same manager only beats the benchmark 60% of the time for 5 year periods, then the investor’s holding period needs to be much longer than 5 years in order to have confidence that the investment will perform better than the benchmark. On the other hand, a single data point of 5 and 10 year returns, as in the typical trailing return method, is simply insufficient to reach this conclusion.
In addition to the percentage of outperformance of rolling periods, other statistics might also be helpful, such as the minimum outperformance (or returns), maximum outperformance (or returns), average or median outperformance (or returns), and standard deviation of outperformance (or returns).
Examples Using Respected Value Investors
In the post financial crisis bull market, the records of many respected (or previously respected) value investors have come under great scrutiny, as many trailing returns have underperformed the market, even for 10 or more years. The following pages show overall and rolling period performance statistics for different value investors across different historical periods. The funds include several from Buffett’s famous “Super Investors of Graham and Doddsville” as well as later value investors that have been admired over the years. Except for Buffett, these funds are listed in date order: Warren Buffett (1957- 1969), Walter Schloss (1956-2002), Charlie Munger (1962-1975), Tweedy Browne Partnership (1958- 1983), Sequoia Fund (1970-Current), Davis Venture Fund (1970-Current), Tom Russo (1984-Current), Francis Chou (1984-Current), Longleaf Partners (1988-Current), Tom Gayner (1990-Current), Bill Nygren (1992-Current), Chuck Akre (1993-Current), Yactkman Fund (1993-Current), Francis Rochon (1993- Current), Tweedy Browne Value Fund (1994-Current), Guy Spier (1997-Current), Mohnish Pabrai (2000- Current), Bruce Berkowitz (2000-Current), Arlington Value Capital (2000-Current), and Austin Value Capital (our record) (2010-Current).
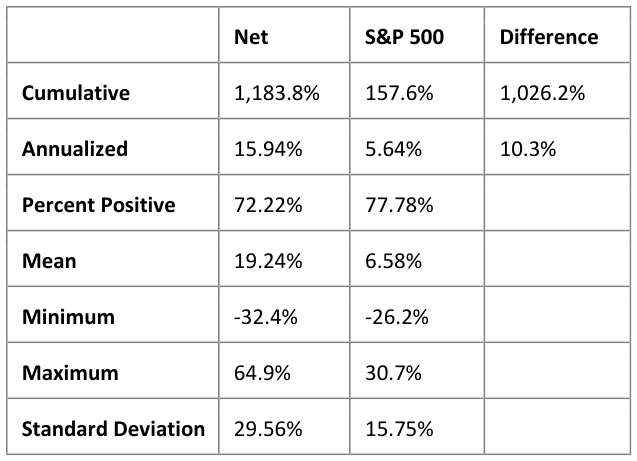
Buffett Partnership (1957-1969)
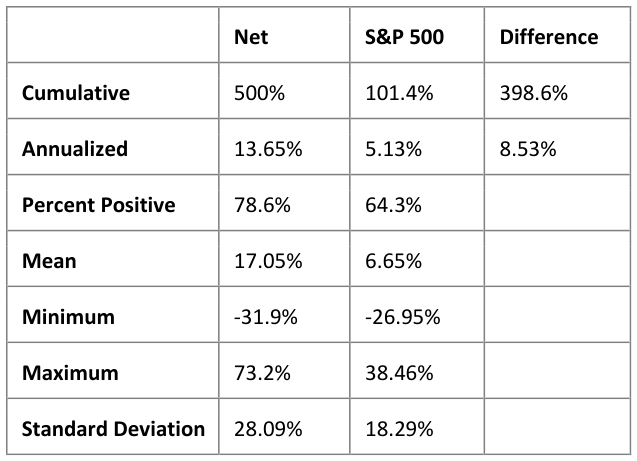
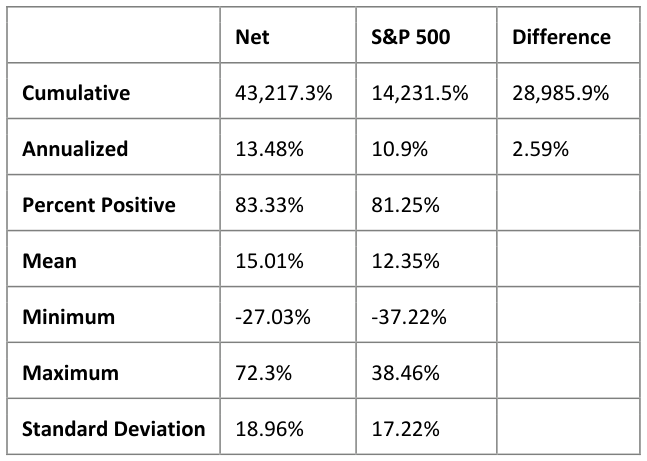
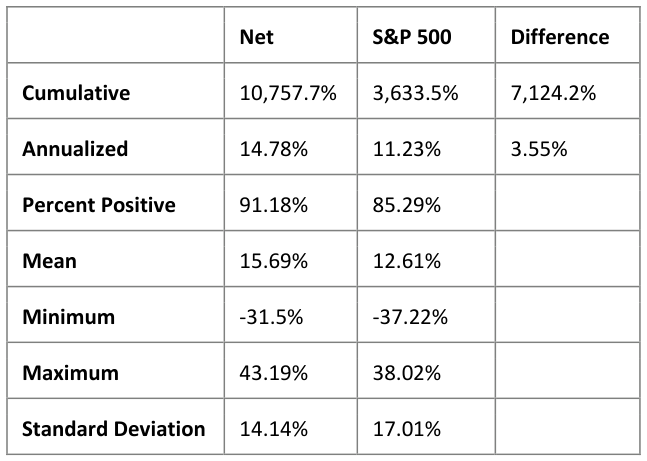
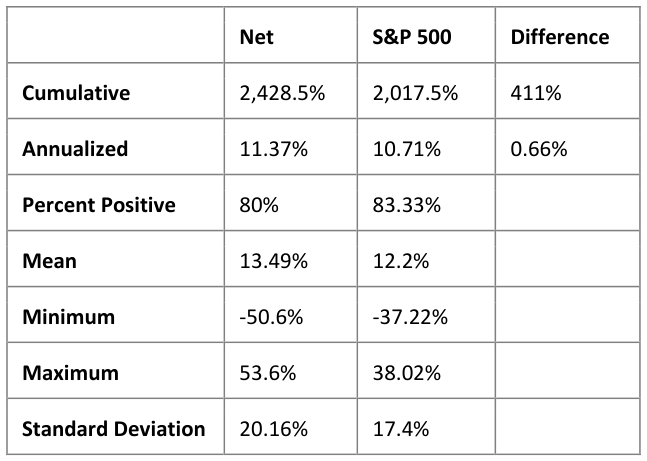
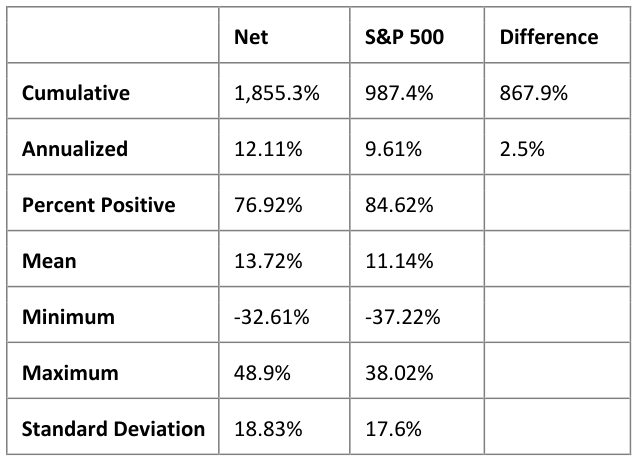
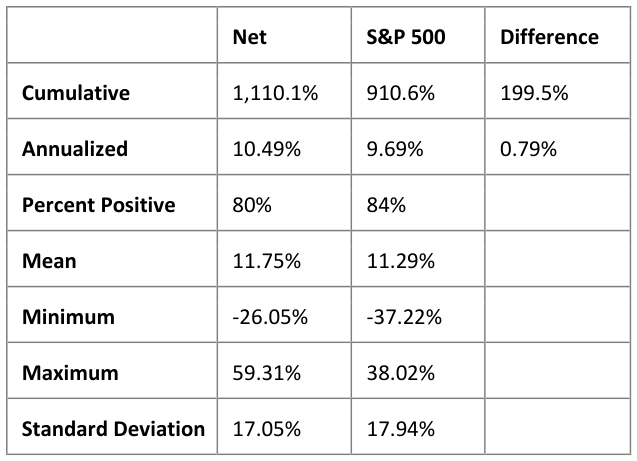
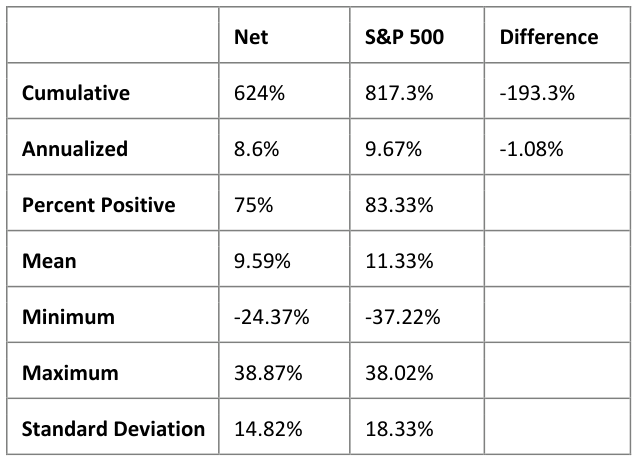
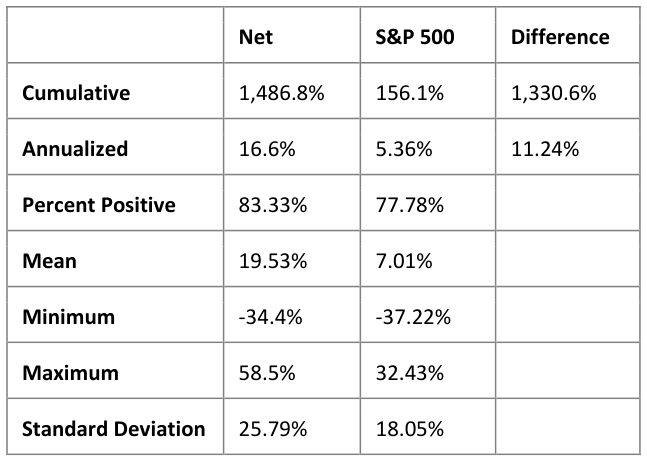
As with most of these essays, it seems prudent to start with Warren Buffett. During the time of his partnership, Buffett mostly bought what he called “Cigar Butts” which were statistically cheap companies only good for “one last puff”. The net overall performance is as follows:
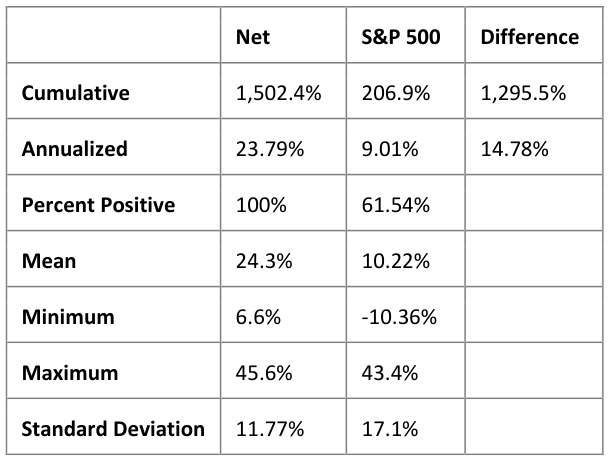
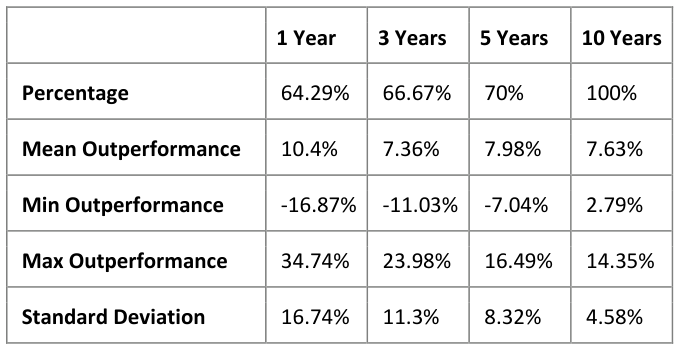
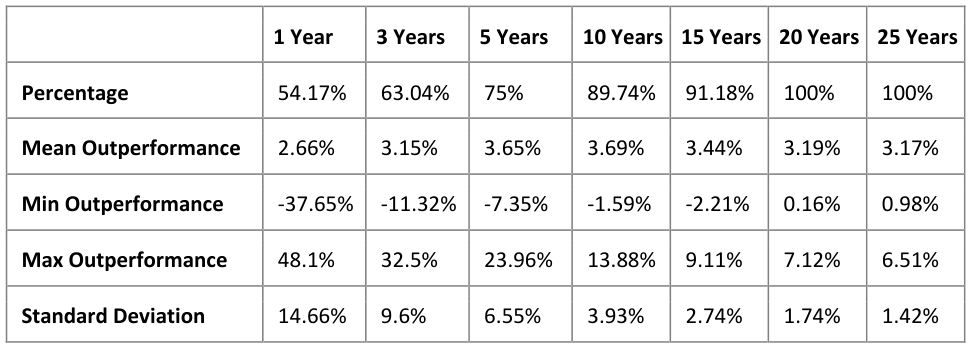
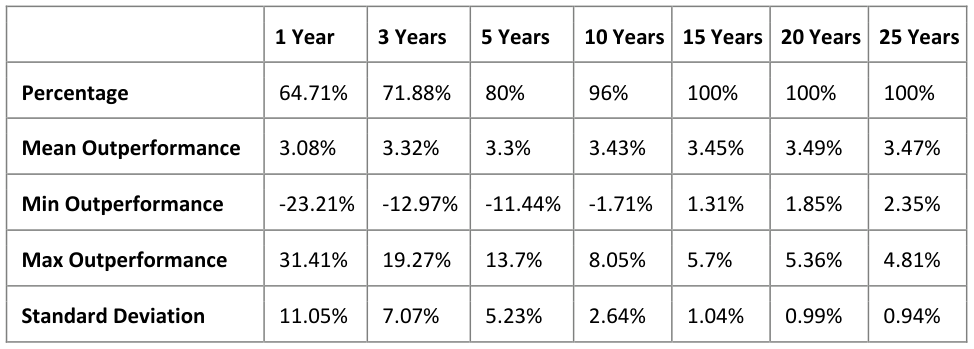
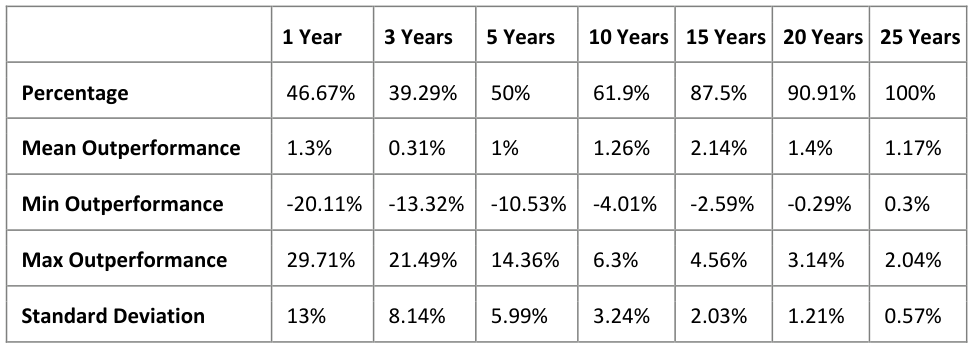
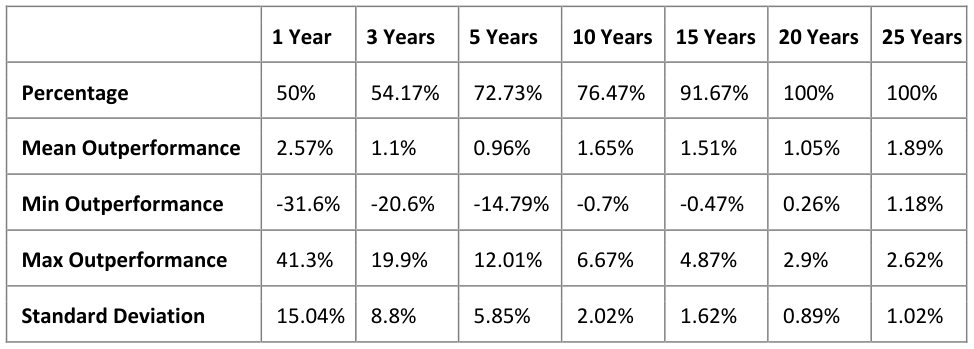
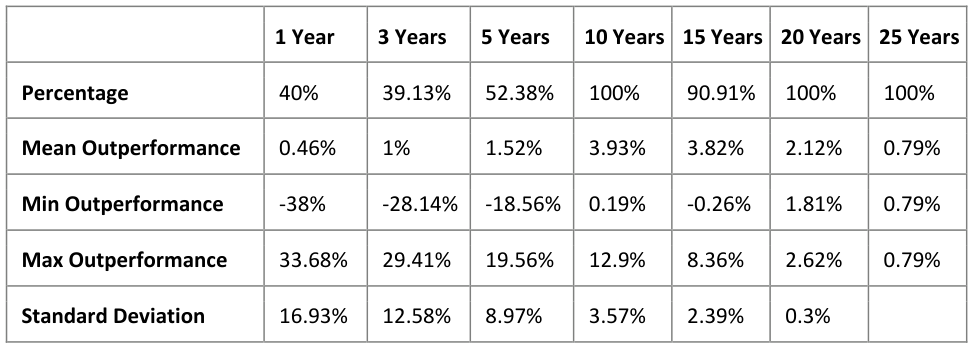
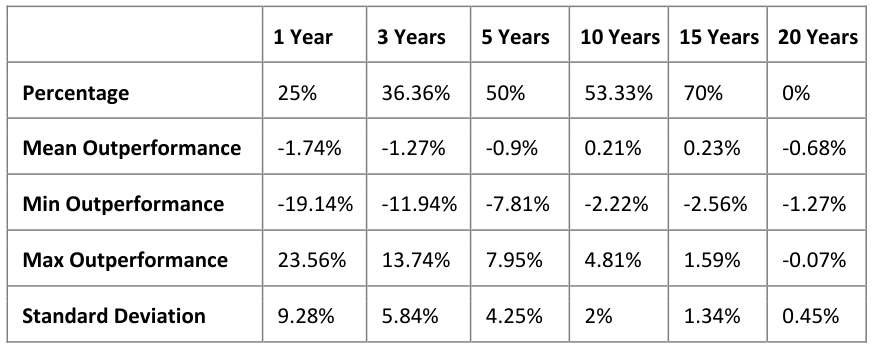
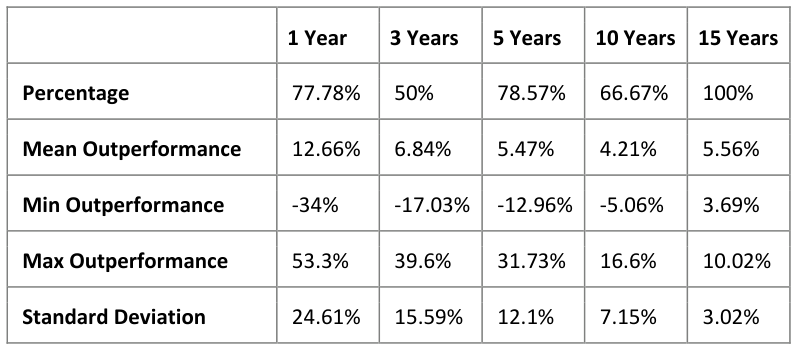
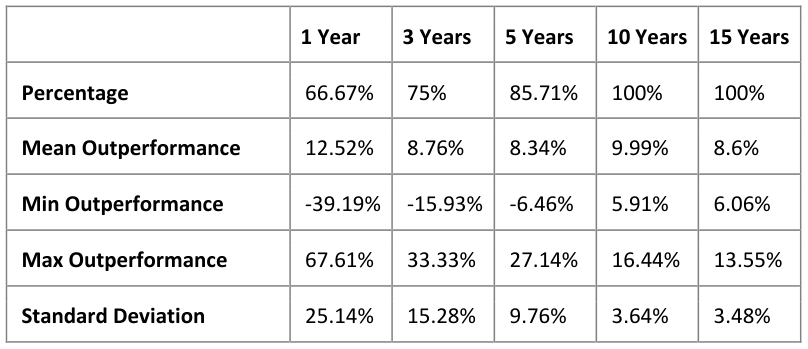
The following lists the annualized rolling statistics for his partnership results, net of compensation. Note that all of these values are the annualized differences to the S&P 500.
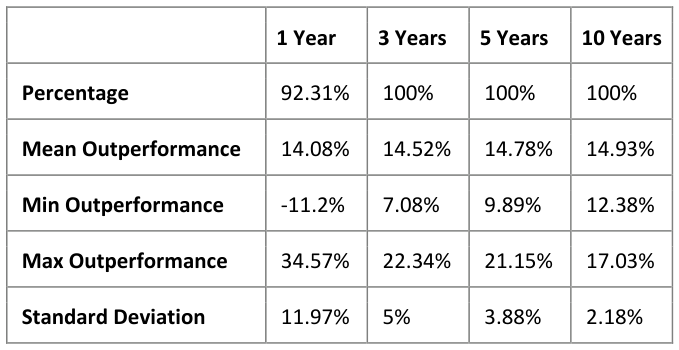
As expected, these returns are outstanding; however, Buffett did recognize how much more difficult this performance would be in the coming years and decided to close the partnership proactively. Further, Buffett did value controlled businesses using his own valuation method rather than market values.
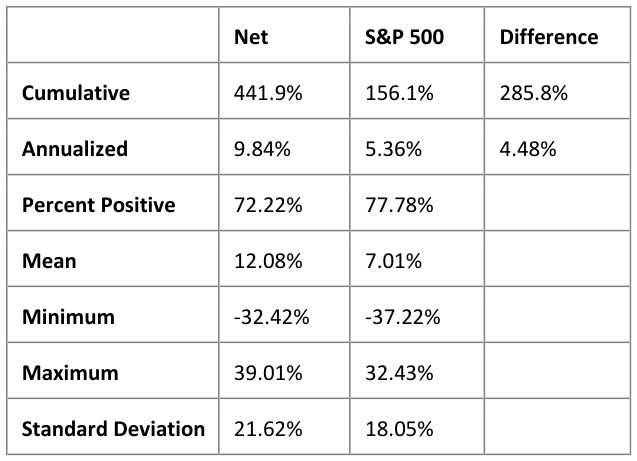
Schloss Partnership (1956-2002)
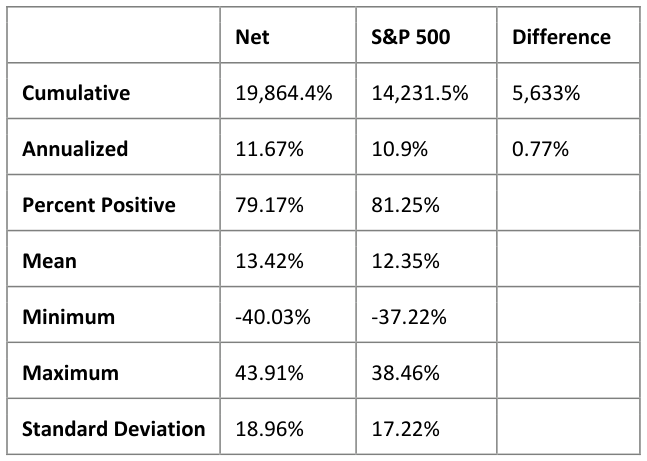
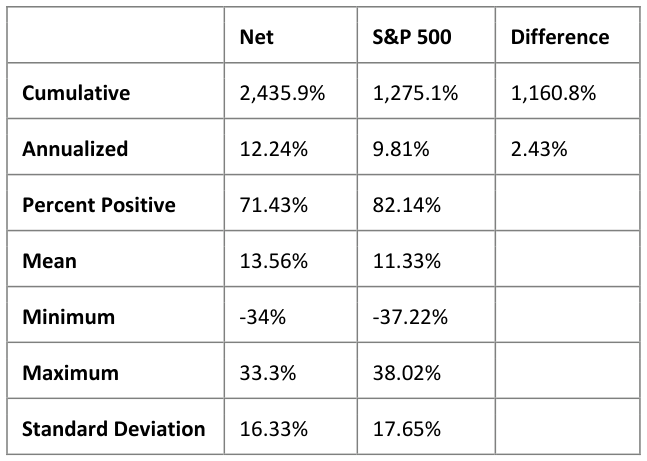
Walter Schloss is a famous investor identified by Buffett in his “Super Investors of Graham and Doddsville”. Schloss generally invested in a wide variety of stocks, looking for anything that seemed cheap based on net asset value or book value, similar to the Buffett partnership. He retired from managing money in 2002 and died in 2012.
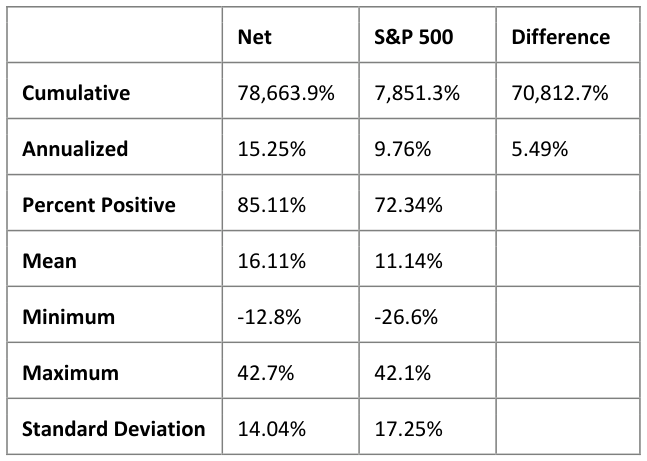
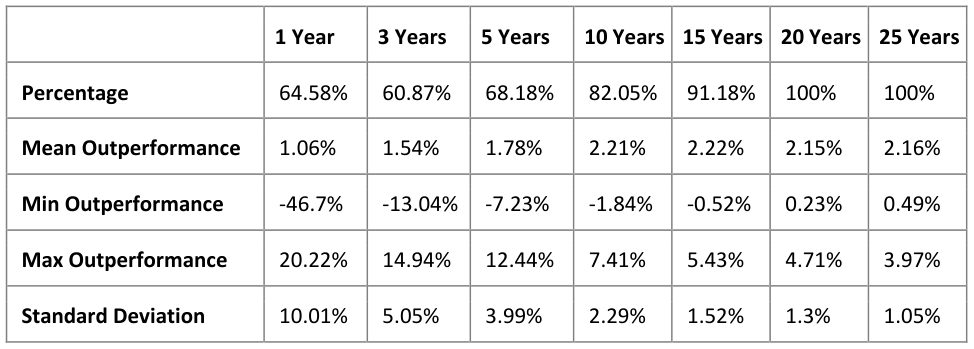
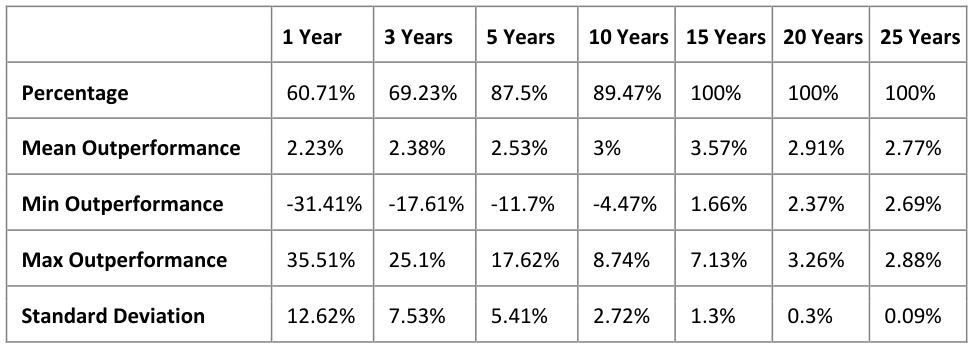
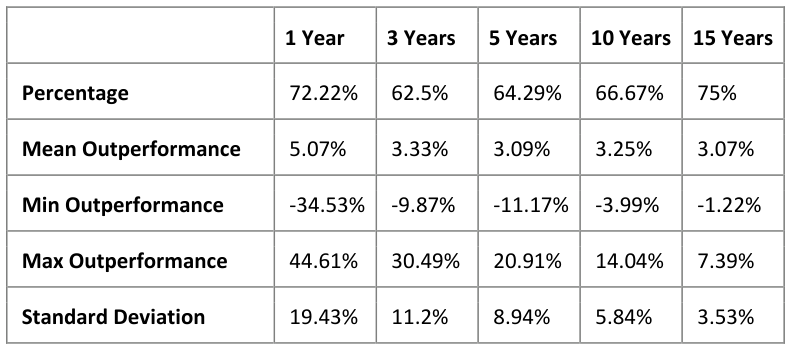
The following lists the annualized rolling statistics for his partnership results, net of compensation.
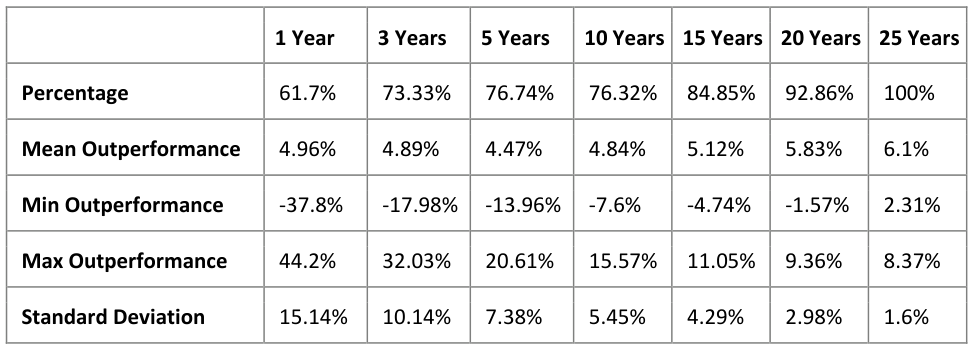
Schloss’ 47-year record was more than 50% higher than the S&P returns (on an annual basis) over the entire period, which is remarkable. Almost the entirety of the periods that he underperformed were in the late 80’s and the tech bubble in the late 90’s. Nonetheless, there were even periods of 20 years where he did not beat the benchmark, which required an extreme degree of patience from his investors.
Munger Partnership (1962-1975)
Charlie Munger’s partnership was longer and later than Buffett’s, but he soon joined Buffett at Berkshire Hathway. Munger’s portfolio was much more concentrated and used leverage, which increased its volatility. Various sources indicate that Munger focused on leveraged arbitrage as well as concentration in higher quality companies, such as Blue Chip Stamps and New America.
The following lists the annualized rolling statistics for his partnership results, net of his compensation.
Munger’s statistics are close to the expected values, where outperformance increases from mid 60% to 100% as the holding period increases from 1 year to 10 years. However, it was a bit of a wild ride for investors, particularly during the bear market of 1970-1974, when Munger underperformed four out of five years.
Tweedy Browne Partnership (1968-1983)
Tweedy Browne is another investor Buffett identified in his “Super Investors” article. Tweedy Browne focused on wide diversification in cheap stocks, similar to Schloss. The performance of their partnership, as listed in the article is as follows:
The following lists the annualized rolling statistics for the partnership results, net of compensation.
Tweedy’s partnership statistics are quite good; however, as shown later, their more recent mutual fund performance is much less appealing.
Sequoia Fund (1970-Current)
Sequoia Fund is another one of Buffett’s “Super Investors” and has had a good long-term record, although it encountered a major setback due to its Valeant investment. They have historically invested in high quality companies with strong management for long periods of time.
The following lists their annualized rolling statistics for the fund, net of fees.
Sequoia’s performance is extremely consistent and predictable. Over longer periods, they have almost always outperformed by 3% or more per annum and their consistency increases as the holding period extends.
Davis Venture Fund (1970-Current)
The Davis Venture Fund, managed over the generations by various Davis family members, largely focuses on high quality financial investments.
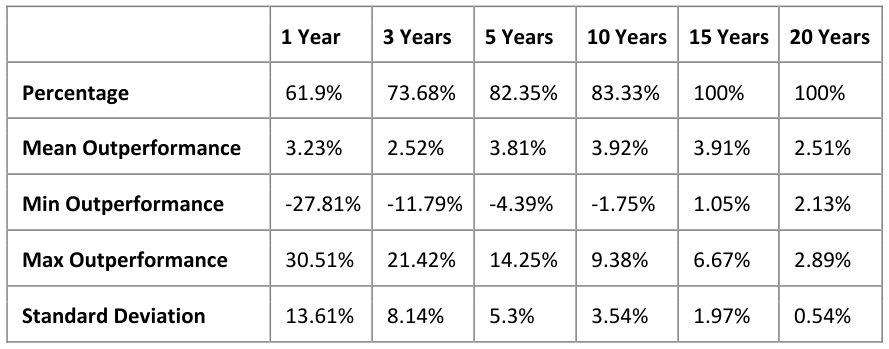
The following lists their annualized rolling statistics for the fund, net of fees.
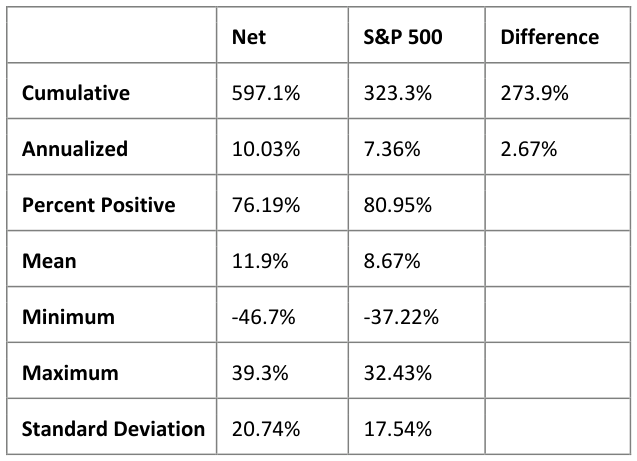
Almost the entirety of the Davis’ underperformance has come from the financial crisis and the following years, although the initial year underperformed by 46.7% due largely to an initial investment style that was not all that value oriented.
Semper VIC (1984-Current)
Tom Russo has had a consistently good record investing in high quality companies and management that he has held for extremely long periods of time. His overall performance is listed below.
The following lists the annualized rolling statistics for his partnership results, net of his compensation.
Russo’s record is impressive as it is, but it is even more so given how little taxes he has incurred for his partners. The tax effects lower the annual returns by less than 1%, which is no small feat for portfolio managers.
Chou Associates (1984-Current)
Francis Chou has generally had good a long-term record and is well known to Canadian investors. He typically invests in cheap companies as well as distressed debt. His overall performance is listed below (both results in Canadian dollars).
The following lists the annualized rolling statistics for the fund, net of fees.
Chou’s record has suffered from underperformance in 4 of the last 5 years, which has resulted in overall underperformance since inception. In previous streaks of underperformance, he has come out ahead once the market turns.
Longleaf Partners (1988-Current)
Longleaf Partners is a mutual fund launched in 1987 and managed by Southeastern Asset Management. They generally focus on strong companies with high-quality management.
The following lists the annualized rolling statistics for the fund, net of fees.
Longleaf’s long term record (and related statistics) has dropped dramatically due to underperformance over the last 10 and 15 year periods, similar to other value-based funds.
Tom Gayner (1990-Current)
Tom Gayner took over investing for Markel in 1990 and has continued ever since. He tends to invest in high-quality companies with good management and low debt, almost always keeping position sizes below 5%.
The following lists the annualized rolling statistics for the fund, net of fees.
Gayner’s statistics are remarkably consistent, and he has shown a low-turnover, diversified portfolio of high-quality companies can do very well over the long term.
Oakmark Fund (1992-Current)
Oakmark Fund is a mutual fund managed by Bill Nygren, which was launched in 1992. Nygren focuses on companies with owner-oriented management.
The following lists the annualized rolling statistics for the fund, net of fees.
Oakmark’s long term record has been fairly consistent over the years. The longest period of underperformance was during the tech bubble of the late 90’s.
Braddock Partners (1993-Current)
Braddock Partners is a partnership that is managed by Chuck Akre. Akre focuses on extraordinary businesses with talented management and great reinvestment opportunities and histories.
The following lists the annualized rolling statistics for the fund, net of fees.
Akre’s record is virtually spotless. He also manages the mutual fund Akre Focus Fund, which, combined with his previous mutual fund under FBR, has at least as good performance as Braddock Partners over similar time periods.
Yacktman Fund (1993-Current)
Yacktman Fund is a mutual fund that was launched by Donald Yacktman in 1993, which is now managed by his son Stephen Yacktman. Yacktman focuses on good businesses with shareholder-oriented management.
The following lists the annualized rolling statistics for the fund, net of fees.
Yacktman’s long term record is fairly good. Underperformance largely occurred in the last few years as well as during the tech bubble of the late 90’s.
Giverny Capital (1993-Current)
Giverny Capital is a management firm run by Francois Rochon, with an excellent long-term record. Rochon focuses on outstanding companies with long holding periods. The following lists the results of the global portfolio, which combines returns of all family accounts managed by Rochon (in Canadian dollars).
The following lists the annualized rolling statistics for the global portfolio, net of fees.
Rochon’s record is consistent and impressive with very little to complain about.
Tweedy Browne Value Fund (1994-Current)
The Tweedy Browne Value Fund is a mutual fund run by Tweedy Browne, which was launched in 1994. Similar to the previous partnership, the value fund owns a wide variety of stocks based on classical cheapness.
The following lists the annualized rolling statistics for the fund, net of fees.
This mutual fund is typically compared against a global benchmark (rather than the S&P 500 here) as they lifted their “more than 50% in U.S. equities” requirement in 2013. The S&P 500 benchmark is used throughout this essay, so it is maintained in this analysis for consistency.
Aquamarine Fund (1997-Current)
Guy Spier is a Buffett acolyte who generally invests in “growth at a reasonable price” (GARP) stocks, although he has been influenced towards distressed and cheaper stocks by Mohnish Pabrai in recent years.
The following lists the annualized rolling statistics for his partnership results, net of his compensation.
Spier has a 20-year record that has outperformed and has largely only suffered from underperformance during the tech bubble of the late 90’s and 2014-2016. His 2017 returns were very strong against the benchmark.
Pabrai Investment Fund (2000-Current)
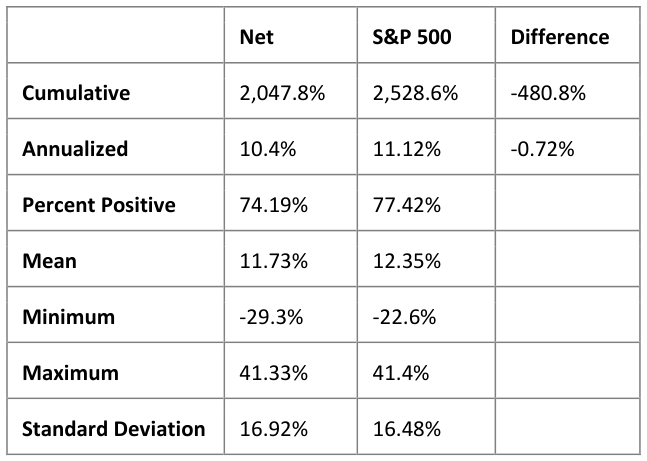
Mohnish Pabrai is another more recent value manager that has been at times praised and admired, and more recently, criticized. He generally invests in cheap companies that he considers to have a good chance of at least doubling in a relatively short period of time, although this style has led to investments in several bankruptcies. As of Q3 2017, his overall performance is as follows:
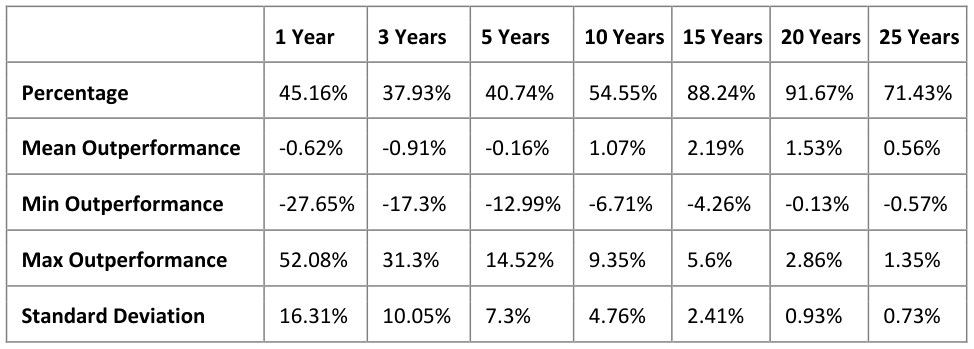
The following lists the annualized rolling statistics for his partnership results, net of his compensation.
Pabrai’s performance started very strong from 2000-2004, but suffered from large underperformance in 2008, 2011, 2014, and 2015. However, subsequent large outperformance allowed for a positive long- term record to investors that were patient, as was the case in 2017.
Fairholme Fund (2000-Current)
Bruce Berkowitz was Morningstar’s “Fund Manager of the Decade” for 2000-2010 and reached an AUM of nearly 20 billion dollars. However, a period of large underperformance against the benchmark from 2011 resulted in more than 75% of investors leaving the fund. He is generally a highly concentrated, deep value investor.
The following lists the annualized rolling statistics for the fund, net of fees.
Berkowitz recent performance has severely impacted his long-term record. His latest heavily- concentrated investments in Sears and Fannie Mae may potentially make or break his long-term record.
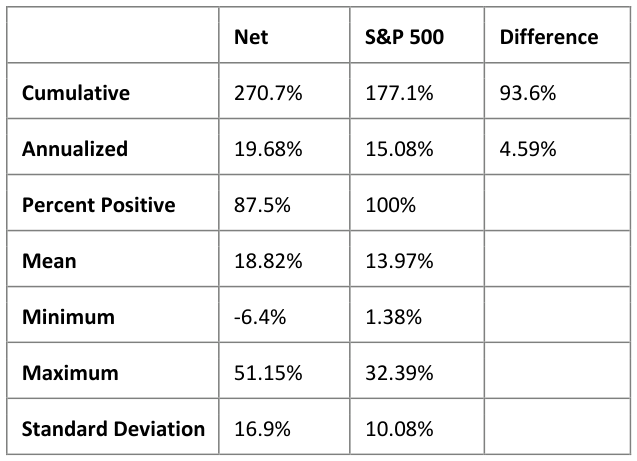
Arlington Value Capital (2000-Current)
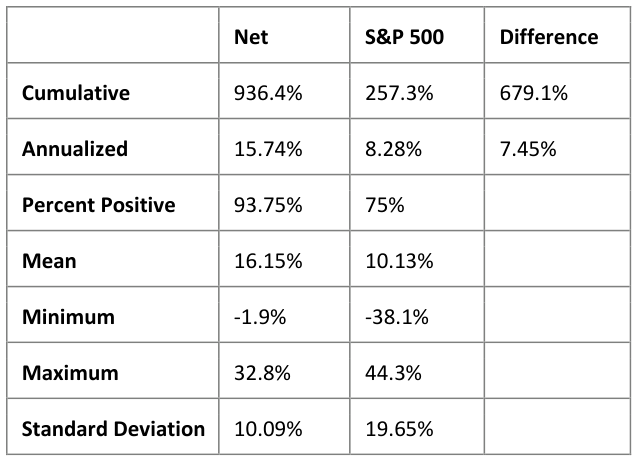
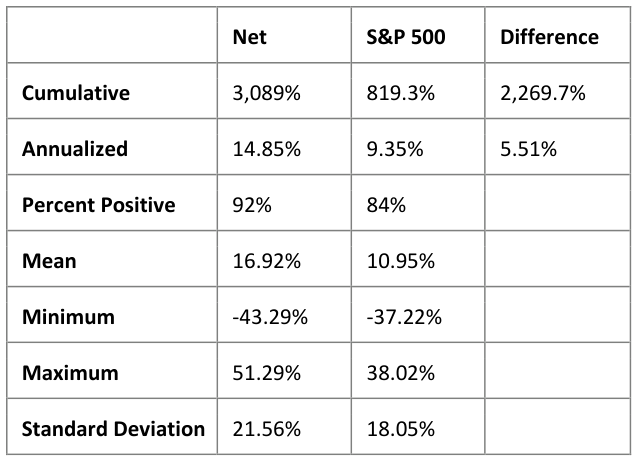
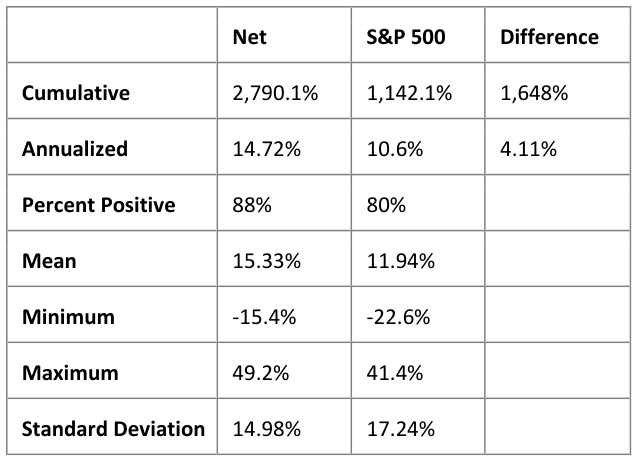
Allan Mecham has one of the most impressive modern day records, which speaks for itself. He generally invests in an opportunistic and concentrated manner, with some focus on quality management and reinvestment opportunities.
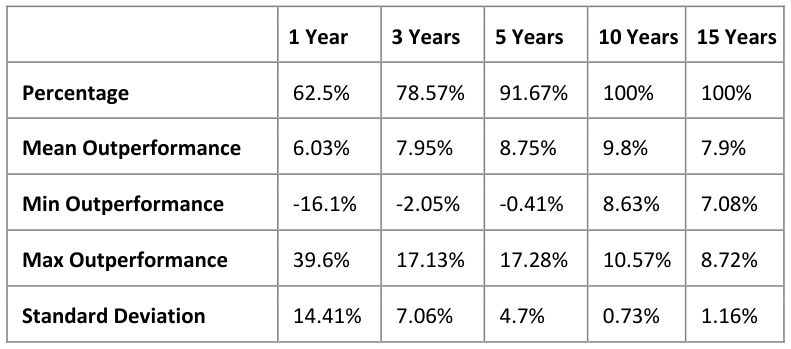
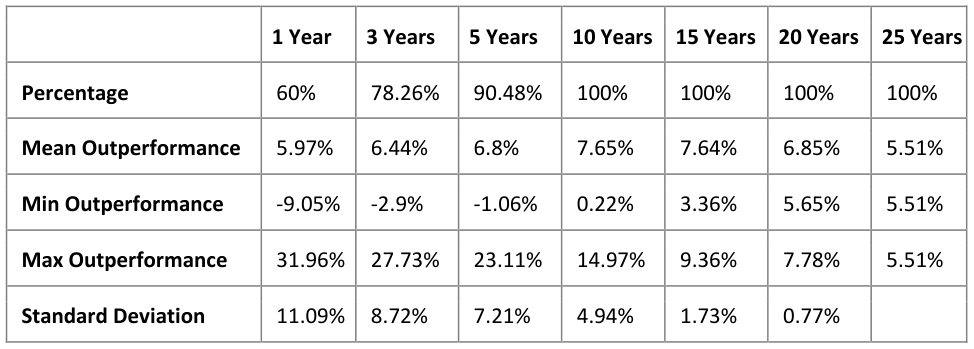
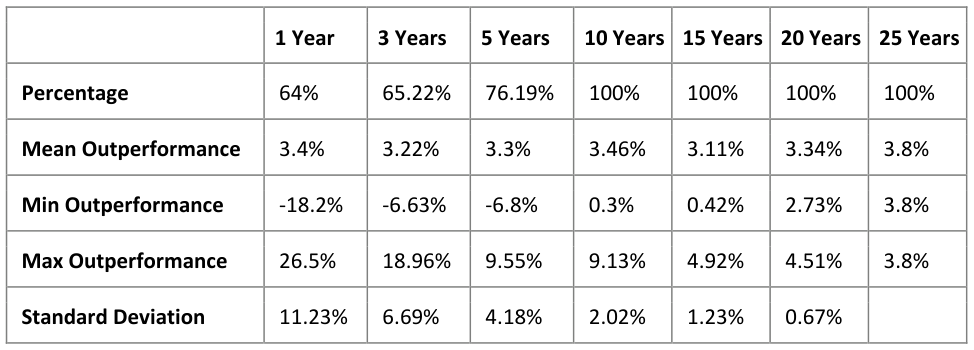
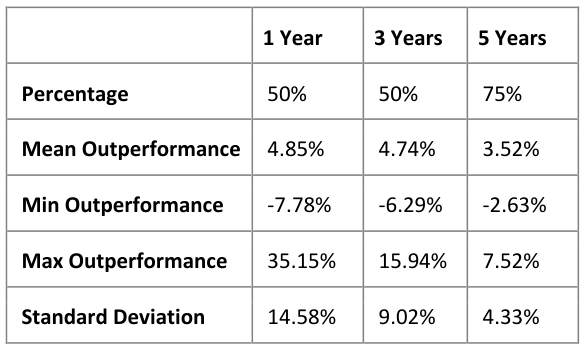
The following lists the annualized rolling statistics for his partnership results, net of his compensation.
Mecham has maintained a stellar record of outperformance that is increasingly stable as the holding period lengthens. Particularly noteworthy, Mecham has managed to outperform the S&P 500 in recent years, unlike nearly all of his value investor cohorts.
Austin Value Capital (2010-Current)
For completeness, the combined personal record of Joel Stevens and Austin Value Capital is provided below.
The following lists the annualized rolling statistics for the combined returns, net of costs and fees.
It remains to be seen how performance will stack up over the long-term.
Graphical Extension
While the tables above provide a quick text-based summary of performance throughout the manager’s investing history, the data can also be represented in a graphical format. For example, a histogram of each rolling year period allows an evaluator to see the frequency of different outcomes. The following histogram shows the annualized 10 year outperformance of Walter Schloss vs the S&P 500 over his entire investing period (1956-2002)
Schloss 10 Year Outperformance
Frequency More 10 Year Relative Performance
Showing Development Over Time
One issue with both the table summaries and using histograms is that they do not do a good job of showing how the performance develops over time. For example, if a manager’s performance was good for a first period (e.g., with less capital under management) and poor for a second period (e.g., with significantly more capital under management), that information is lost to the potential investor. The tables and histogram could be modified to only show a moving window of time or show the statistics for multiple time periods. Alternatively, each year’s rolling performance can be shown in a line graph relatively easily, either for individual rolling periods or for multiple rolling periods. The following shows Schloss’ rolling 5, 10, and 15 year relative returns over time.
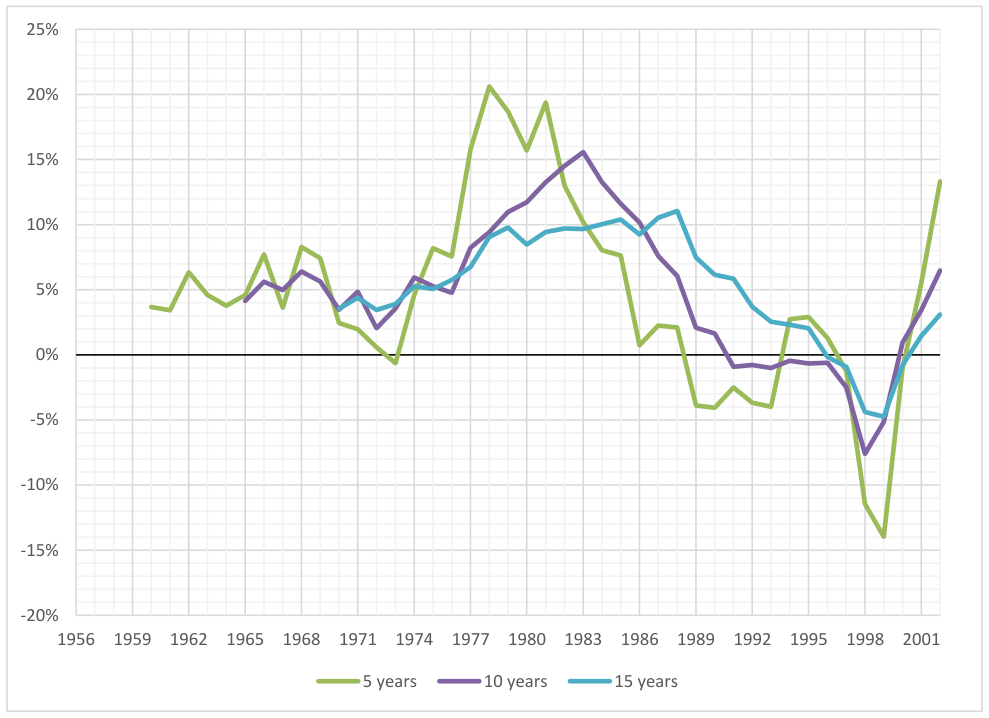
As shown, Schloss maintained positive 5, 10, and 15 year rolling records consistently until the 90’s, and results returned to positive after the bursting of the tech bubble.
Conclusion
The presented rolling period analysis overcomes the endpoint problem presented by listing only 1, 3, 5, and 10 year trailing returns. Additionally, it may give a prospective investor insight into the holding periods required for probable outperformance for a manager. Further, while these rolling statistics provide a much richer view of overall performance, this method tends to deemphasize recent performance. This issue may be easily overcome by modifying the statistical period from the entire investment history to a more recent set of years or by showing the development over time as in the graph above.
Moreover, looking at the returns of the various investors, it appears that the value investors that focused on cheap stocks (with less emphasis on high-quality companies and long holding periods) outperformed consistently in earlier investing time periods (e.g., Buffett, Schloss, Tweedy Browne Partnership). However, their modern counterparts (e.g., Chou, Berkowitz, Pabrai, Tweedy Browne Fund) are both more volatile and more exposed to the value cycle of markets (e.g., where ‘value’ stocks
underperform for years at a time). On the other hand, value managers that are able to identify and invest in great companies that compound over time appear to have more consistent records, which may be more psychologically friendly to investors in their funds.
Updated April 13, 2018